In the past few weeks, climate records have shattered across the globe. July 4 was the hottest global average day on record, breaking the new record set the previous day. Average sea surface temperatures have been the highest ever recorded and Antarctic sea ice extent the lowest on record.
Also on July 4, the World Meteorological Organization declared El Niño had begun, “setting the stage for a likely surge in global temperatures and disruptive weather and climate patterns”.
So what’s going on with the climate, and why are we seeing all these records tumbling at once?
Against the backdrop of global warming, El Niño conditions have an additive effect, pushing temperatures to record highs. This has combined with a reduction in aerosols, which are small particles that can deflect incoming solar radiation. So these two factors are most likely to blame for the record-breaking heat, in the atmosphere and in the oceans.
It’s not just climate change
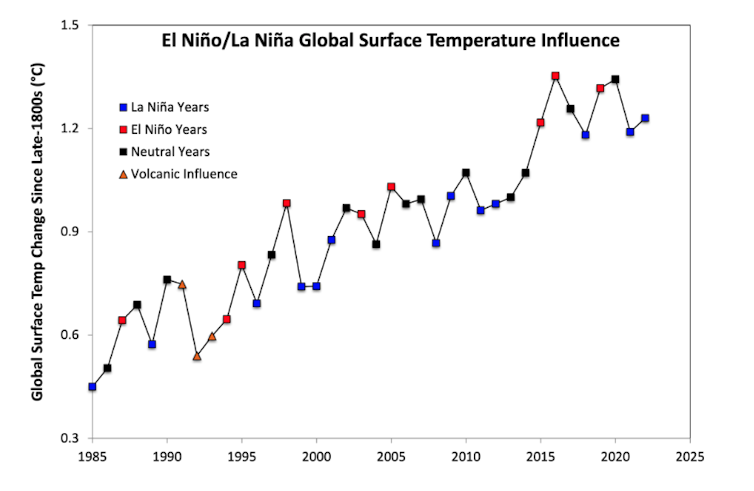
The extreme warming we are witnessing is in large part due to the El Niño now occurring, which comes on top of the warming trend caused by humans emitting greenhouse gases.
El Niño is declared when the sea surface temperature in large parts of the tropical Pacific Ocean warms significantly. These warmer-than-average temperatures at the surface of the ocean contribute to above-average temperatures over land.
The last strong El Niño was in 2016, but we have released 240 billion tonnes of CO₂ into the atmosphere since then.
El Niño doesn’t create extra heat but redistributes the existing heat from the ocean to the atmosphere.

Dana Nuccitelli, using data from Berkeley Earth, author provided
The ocean is massive. Water covers 70% of the planet and is able to store vast amounts of heat due to its high specific heat capacity. This is why your hot water bottle stays warm longer than your wheat pack. And, why 90% of the excess heat from global warming has been absorbed by the ocean.
Ocean currents circulate heat between the Earth’s surface, where we live, and the deep ocean. During an El Niño, the trade winds over the Pacific Ocean weaken, and the upwelling of cold water along the Pacific coast of South America is reduced. This leads to warming of the upper layers of the ocean.
Higher than usual ocean temperatures along the equator were recorded in the first 400m of the Pacific Ocean throughout June 2023. Since cold water is more dense than warm water, this layer of warm water prevents colder ocean waters from penetrating to the surface. Warm ocean waters over the Pacific also lead to increased thunderstorms, which further release more heat into the atmosphere via a process called latent heating.
This means that the build up of heat from global warming that had been hiding in the ocean during the past La Niña years is now rising to the surface and demolishing records in its wake.

Bureau of Meteorology, Author provided
An absence of aerosols across the Atlantic
Another factor likely contributing to the unusual warmth is a reduction in aerosols.
Aerosols are small particles that can deflect incoming solar radiation. Pumping aerosols into the stratosphere is one of the potential geoengineering methods that humanity could invoke to lessen the impacts of global warming. Although stopping greenhouse gas emissions would be much better.
But the absence of aerosols can also increase temperatures. A 2008 study concluded that 35% of year-to-year sea surface temperature changes over the Atlantic Ocean in Northern Hemisphere summer could be explained by changes in Saharan dust.
Saharan dust levels over the Atlantic Ocean have been unusually low lately.
On a similar note, new international regulations of sulphur particles in shipping fuels were introduced in 2020, leading to a global reduction in sulphur dioxide emissions (and aerosols) over the ocean. But the long-term benefits of reducing shipping emissions far outweighs the relatively small warming effect.
This combination of factors is why global average surface temperature records are tumbling.
Are we at the point of no return?
In May this year, the World Meteorological Organization declared a 66% chance of global average temperatures temporarily exceeding 1.5℃ above pre-industrial levels within the next five years.
This prediction reflected the developing El Niño. That probability is likely higher now, since El Niño has developed.
It is worth noting that temporarily exceeding 1.5℃ does not mean we have reached 1.5℃ by the Intergovernmental Panel on Climate Change standards. The latter describes a sustained average global temperature anomaly of 1.5℃, rather than a single year, and is likely to occur in the 2030s.
This temporary exceedance of 1.5℃ will give us an unfortunate preview of what our planet will be like in the coming decades. Although, younger generations may find themselves dreaming of a balmy 1.5℃ given current greenhouse emissions policies put us on track for 2.7℃ warming by the end of the century.
So we are not at the point of no return. But the window of time to avert dangerous climate change is rapidly shrinking, and the only way to avert it is by severing our reliance on fossil fuels.![]()
Kimberley Reid, Postdoctoral Research Fellow in Atmospheric Sciences, Monash University. This article is republished from The Conversation under a Creative Commons license. Read the original article.


