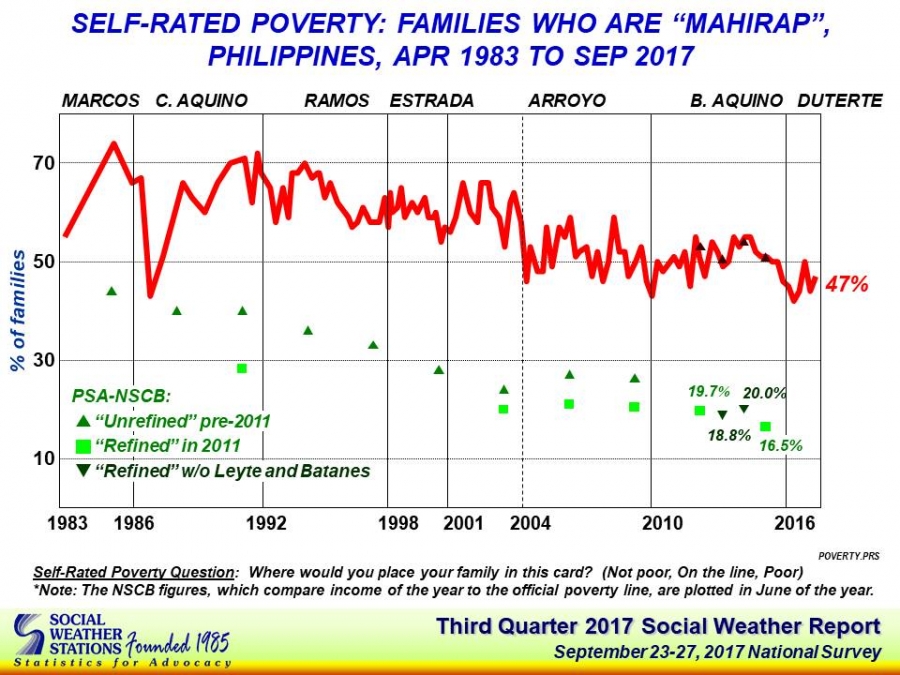
The 2017 Third Quarter Social Weather Survey (SWS) found that, statistically, some 47 percent of families consider themselves as “Mahirap”, or Poor.
This is three points above the 44% in June 2017 (Second quarter).
This third quarter survey was done on September 23-27, 2017.
According to SWS, the proportion of Self-Rated Poor families “had a sharp increase from 44% in December 2016 to 50% in March 2017. Before this, it had been either steady or declining for nine consecutive quarters, from the fourth quarter of 2014 to the fourth quarter of 2016.”
The September 2017 survey also found 32% of families rating their food as Mahirap or Poor, termed by SWS as “Food-Poor.”
This is similar to the 32% in June 2017 but below the 35% of March 2017.
Prior to this, Self-Rated Food-Poverty averaged 31% in 2016 and 35% in 2015.
Transitioning in and out of poverty
Since December 2014, SWS asked its self-rated poor respondents if they have ever experienced not being poor, and if so, when they most recently experienced it.
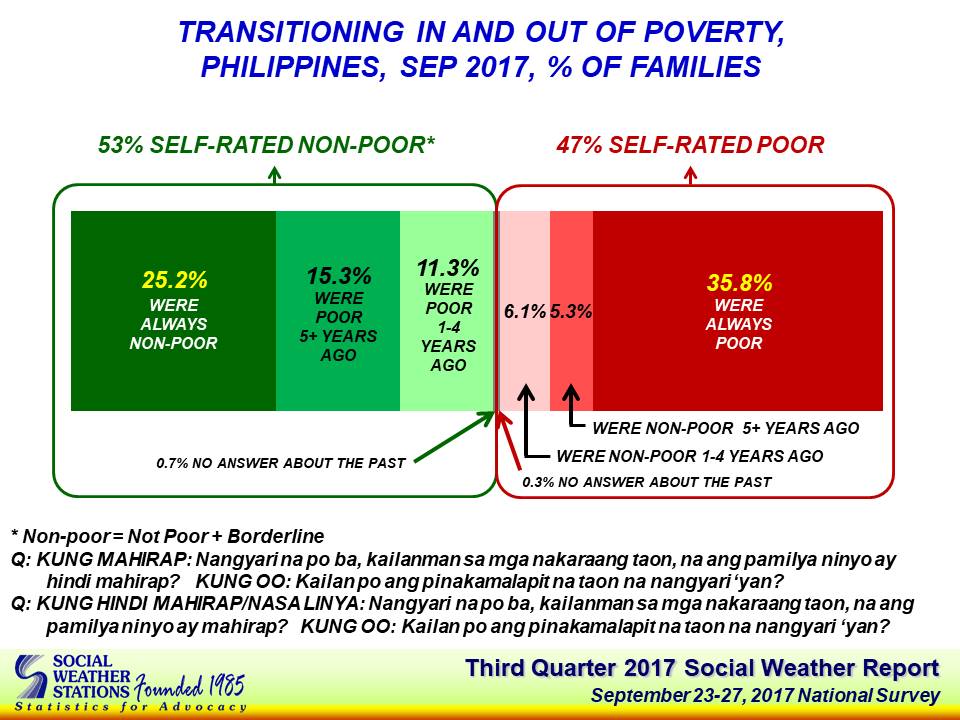
The September 2017 survey found that three-fourths of self-rated poor families, or 36% of Filipino families overall, have always considered themselves as being poor.
It found that one-fourth of self-rated poor families, or 11% of families overall, were not poor sometime in the past. Of these 11%, 6% are newly poor, meaning they became poor sometime in the last four years, and 5% are usually poor, meaning they became poor 5 or more years ago.
SWS also asked its self-rated non-poor (including borderline) respondents if they have ever experienced being poor, and if so, when they most recently experienced it.
The September 2017 survey found that half of self-rated non-poor families, or 25% of families overall, have never been poor.
It found that half of non-poor families, or 27% of families overall, were poor sometime in the past. Of these 27%, 11% are newly non-poor, meaning they were poor sometime in the last four years, and 15% are usually non-poor, meaning they were poor 5 or more years ago.
SWS is to release a more detailed report on Filipino families’ transition in and out of poverty.
Thresholds and gaps
The median Self-Rated Poverty Threshold, or the monthly budget that a poor household needs for home expenses in order not to consider itself poor in general, is P10,000. This has been the case since September 2016.
The September 2017 survey also found that the median Self-Rated Poverty Gap, or the amount poor families need to make up for in monthly home expenses relative to their stated threshold, was unchanged at P5,000.
Food
Meanwhile, the national median Self-Rated Food Poverty Threshold, or the monthly budget that a food-poor household needs for food expenses in order not to consider its food as poor, is at P5,000.
The national median Self-Rated Food Poverty Gap, or the amount that food-poor families lack in monthly food expenses relative to their stated threshold, is P2,000. These values are lower in September 2017 compared to their June 2017 counterparts, and are similar to their December 2016 and March 2017 counterparts.
Transportation
Since June 2017, SWS has asked its respondents how much their family spends on transportation in a month?
The September 2017 survey found that Filipino households spend a median of P1,000 on monthly transportation.
SWS is likewise set to release a more detailed report on Filipino families’ transportation expenses.
Self-Rated Poverty measures the proportion of respondents rating their family as poor or mahirap, while the Self-Rated Poverty Threshold (SRPT) is the minimum monthly budget poor families need for home expenses in order not to be poor.
Self-Rated Food Poverty, meanwhile, measures the proportion of respondents rating the food their family eats as poor or mahirap, while the Self-Rated Food Poverty Threshold (SRFPT) is the minimum monthly food budget poor families need in order for their food not to be poor.
Survey Background
This survey was conducted from September 23-27, 2017 using face-to-face interviews of 1,500 adults (18 years old and above) nationwide: 600 in Balance Luzon, and 300 each in Metro Manila, Visayas, and Mindanao (sampling error margins of ±2.5% for national percentages, ±4% for Balance Luzon, and ±6% each for Metro Manila, Visayas, and Mindanao) and directed to the household head.
The area estimates were weighted by Philippine Statistics Authority medium-population projections for 2017 to obtain the national estimates.
The survey items are non-commissioned, and are always included on SWS’s own initiative and released as a public service.
SWS employs its own staff for questionnaire design, sampling, fieldwork, data-processing, and analysis, and does not outsource any of its survey operations.

